Data mining
Data mining and its application on vector borne diseases
Datamining
Data mining (knowledge discovery), is the extraction of hidden predictive information from large databases, a powerful technology with great potential to help organizations, companies focus on the most important information in the data warehouses. Data mining is a young and interdisciplinary field, drawing from fields such as database systems, data warehousing, machine learning, statistics, signal analysis, data visualization, information retrieval, and high performance computing. It has been successfully applied in diverse areas such as marketing, finance, engineering, security, games, and science. And rather than comprising a clear cut set of methods, the term “data mining” refers to an eclectic approach to data analysis where choices are led by pragmatic considerations concerning the problem at hand. Broadly speaking, the goals of data mining can be classified into two categories: description and prediction. Descriptive data mining attempts to discover implicit and previously unknown knowledge, which can be used by humans in making decisions. Predictive data mining seeks to find a model or function that predicts some crucial but (yet) unknown property of a given object or a set of currently known properties. Predictive data mining tasks are typically supervised machine learning problems such as regression and classification. Well-known supervised learning algorithms are decision tree learners, rule-based classifiers, Bayesian classifiers, linear and logistic regression analysis, artificial neural networks, and support vector machines.
The core components of data mining technology have been under development for decades, in research various areas such as statistics, artificial intelligence, and machine learning. Today, the maturity of these techniques, coupled with high-performance relational database engines and broad data integration efforts, make these technologies practical for current data warehouse environments. Data mining software analyzes the relationships and patterns in stored transaction data based on open-ended user queries. Generally, there are four types of relationships:
- Classes: Stored data is used to locate data in predetermined groups.
- Clusters: Data items are grouped according to logical relationships or consumer preferences.
- Associations: Data can be mined to identify associations.
- Sequential patterns: Data is mined to anticipate behavior patterns, predictions and trends.
Different levels of analysis in Datamining are:
- Artificial neural networks: Non-linear predictive models that learn through training and resemble biological neural networks in structure.
- Genetic algorithms: Optimization techniques that use processes such as genetic combination, mutation, and natural selection in a design based on the concepts of natural evolution.
- Decision trees: Tree-shaped structures that represent sets of decisions. These decisions generate rules for the classification of a dataset. Specific decision tree methods include Classification and Regression Trees (CART) and Chi Square Automatic Interaction Detection (CHAID). They provide a set of rules that you can apply to a new (unclassified) dataset to predict which records will have a given outcome.
- Nearest neighbor method: A technique that classifies each record in a dataset based on a combination of the classes of the k record(s) most similar to it in a historical dataset (where k 1). Sometimes called the k-nearest neighbor technique.
- Rule induction: The extraction of useful if-then rules from data based on statistical significance.
- Data visualization: The visual interpretation of complex relationships in multidimensional data. Graphics tools are used to illustrate data relationships.
Ref:
http://www.anderson.ucla.edu/faculty/jason.frand/teacher/technologies/palace/datamining.htm
http://www.thearling.com/text/dmwhite/dmwhite.htm
Applications Datamining in Vector Borne Diseases.
Data mining can be applied in biomedicine for a large variety of purposes, and is thus connected to diverse biomedical fields. Traditionally, data mining and machine learning applications focused on clinical applications, such as decision support to medical practitioners and interpretation of signal and image data. More recently, applications in epidemiology, Medical entomology, bioinformatics, and bio surveillance have received increasing attention. From the past few years, Biology Division of IICT is working on the control of vectors and vector borne disease by using various datamining tools (like Self Organizing Maps, CART, kNN and Bayesian network) on Malaria, Filariasis, Dengue, Chikungunya and Japanese Encephalitis. Datamining tool “Self Organizing Map” (SOM) was customized for prioritization of endemic zones of filariasis and malaria which can enable in efficient targeting of the risk areas for control operations. Data mining tools like CART (Correlation and Regression Tree) can also be applied for determining various association rules for effective controlling of vector borne diseases like filariasis.
Bayesian model (JEBNET) that has been developed by IICT for predicting vector density (per man hour density (PMHD)) of Japanese encephalitis (JE) mosquitoes. This software is capable of predicting the PMHD of mosquitoes one year in advance. The algorithm calculates the mosquito population which can occur within maximum likelihood of the given area.
Based on the kNN approach, a novel tool VB Classif ver.1.0 for classification of epidemiological data of vector-borne diseases was developed by IICT. The VBClassif tool classifies disease according to presence or absence of filarial cases which help in devising a clear strategy in mass drug administration programmes. This also helps in proper targeting of patients and in efficient use of resources. Interactive Classification tools supported by AI (Artificial Intelligence) like VB Classif 1.0 will definitely pave way for more efficient disease control and help epidemiologists in finding quick solution to classification problems and classifies the records of those affected by Filariasis. This software has been utilized to classify up to a 100000 records and the effective classification yield percentage is 94%
For more information:
Prioritization of malaria endemic zones using self-organizing maps in the Manipur state of India.
This article was downloaded by: [CSIR eJournals Consortium]
On: 13 October 2008
Access details: Access Details: [subscription number 772699002]
Publisher Informa Healthcare
Informa Ltd Registered in England and Wales Registered Number: 1072954 Registered office: Mortimer House,
37-41 Mortimer Street, London W1T 3JH, U |
Informatics for Health and Social Care
Publication details, including instructions for authors and subscription information:
http://www.informaworld.com/smpp/title~content=t713736879

Prioritization of malaria endemic zones using self-organizing maps in the
Manipur state of India
Upadhyayula Suryanarayana Murty a; Mutheneni Srinivasa Rao a; Sunil Misra a
a Bioinformatics Group, Biology Division, Indian Institute of Chemical Technology (CSIR), Hyderabad, Andhra
Pradesh, India
Online Publication Date: 01 September 2008
To cite this Article Murty, Upadhyayula Suryanarayana, Srinivasa Rao, Mutheneni and Misra, Sunil(2008)'Prioritization of malaria
endemic zones using self-organizing maps in the Manipur state of India',Informatics for Health and Social Care,33:3,170 — 178
To link to this Article: DOI: 10.1080/17538150802457687
URL: http://dx.doi.org/10.1080/17538150802457687 |
PLEASE SCROLL DOWN FOR ARTICLE
Full terms and conditions of use: http://www.informaworld.com/terms-and-conditions-of-access.pdf
This article may be used for research, teaching and private study purposes. Any substantial or
systematic reproduction, re-distribution, re-selling, loan or sub-licensing, systematic supply or
distribution in any form to anyone is expressly forbidden.
The publisher does not give any warranty express or implied or make any representation that the contents
will be complete or accurate or up to date. The accuracy of any instructions, formulae and drug doses
should be independently verified with primary sources. The publisher shall not be liable for any loss,
actions, claims, proceedings, demand or costs or damages whatsoever or howsoever caused arising directly
or indirectly in connection with or arising out of the use of this material. |
Informatics for Health & Social Care
September 2008; 33(3): 170–178
Prioritization of malaria endemic zones using
self-organizing maps in the Manipur state of India
UPADHYAYULA SURYANARAYANA MURTY,
MUTHENENI SRINIVASA RAO & SUNIL MISR
Bioinformatics Group, Biology Division, Indian Institute of Chemical Technology (CSIR),
Hyderabad 500 007, Andhra Pradesh, Indi
Abstract
Due to the availability of a huge amount of epidemiological and public health data that require analysisand interpretation by using appropriate mathematical tools to support the existing method to control themosquito and mosquito-borne diseases in a more effective way, data-mining tools are used to makesense from the chaos. Using data-mining tools, one can develop predictive models, patterns, association rules, and clusters of diseases, which can help the decision-makers in controlling the diseases. This paper mainly focuses on the applications of data-mining tools that have been used for the first time to prioritize the malaria endemic regions in Manipur state by using Self Organizing Maps (SOM). The SOM results (in two-dimensional images called Kohonen maps) clearly show the visual classification of malaria endemic zones into high, medium and low in the different districts of Manipur, and will be discussed in the paper.
Keywords: Clusters, malaria, Manipur, India, self-organizing map
1. Introduction
Malaria imposes a huge burden upon the health and economic development of tropicalnations [2,9] and has been identified as a major obstacle towards achieving several of thehealth-related goals [22,4]. The disease causes widespread premature death and suffering,imposes financial hardship on poor households, retards economic growth, and underminesliving standards. As recently as 1998, about 20,000 people and an estimated 577,000 DALYs
(disability-adjusted life years) were lost due to malaria in India [18]. Approximately 80% ofreported malaria cases in the South East Asia region are from India [23]
The north-eastern region of India comprises seven states (Assam, Arunachal Pradesh, Meghalaya, Manipur, Mizoram, Tripura, and Nagaland) and contributes about 3.96% of the country’s population. Reports on malaria are very common in these regions. Nearly 10.5% of malaria cases and 10% of Plasmodium falciparum (PF), with 20% of deaths, have
-----------------------------------------------------------------------------------------------------------------------------------------------------------
Correspondence: U. Suryanarayana Murty, Biology Division, Indian Institute of Chemical Technology (CSIR), Tarnaka, Hyderabad
500 007, Andhra Pradesh, India. Tel: þ91-040-27193134. Fax: þ91-040-27193227. E-mail: murty_usn@yahoo.com
Informatics for Health & Social Care
September 2008; 33(3): 170–178
ISSN 1753-8157 print/ISSN 1753-8165 online � 2008 Informa UK Ltd.
DOI: 10.1080/1753815080245768
been reported annually. Out of the seven states in the north-eastern region, the state of Manipur is known to be highly endemic for malaria and this has recently become a major public health problem. This state has experienced a resurgence of malaria since 1992, and most of the deaths are reported to be due to PF. Due to a high alarming PF prevalence in this region, various control measures have been taken to prevent PF. Various workers have reported
that control operations are restricted in these areas, and this is mainly due to a lack of proper health-related awareness, ineffective communication between health researchers and policy makers, roads for outreach, and difficulties in health-programme implementation and drug resistance. Favourable eco-climatic conditions (heavy rainfall, high humidity) for mosquito proliferation, survival, and longevity all lead to outbreaks in these regions [6]. Hence, it is essential to know the malarial intensity in different districts of Manipur state to check the prevalence of PF.
Beside conventional methods of control of vector and vector-borne diseases, there are several epidemiological and statistical methods like Bayesian Network prediction models [5,10,21], model checking and hypothesis testing [5], mathematical modelling [1], computer management system [3] being used extensively. Similarly, in the present study,
for the first time Self Organizing Maps (SOM) or Kohonen maps, a data-mining tool has been used to prioritize and cluster the endemic zones of malaria in Manipur. SOM is a statistical method to interpret multidimensional, nonlinear, and highly noisy data onto a two-dimensional grid, grouping similar patterns near each other [8]. Kohonen maps are
a data visualization technique and are powerful tools for classification of hidden information in large datasets [14]. For instance, SOMs were successfully used in prediction of the diterpene skeletons [7] and prediction of cytotoxic potency of chemical compounds [17].
Malaria is spreading rapidly, due to a lack of clear information on endemic areas of malaria where control operations are usually unsuccessful. Hence, depending on the intensity of the parasitic load, it is necessary to classify the collected epidemiological data into high-, medium-, and low-risk areas for malaria. The aim of this paper is to develop SOM models to prioritize the malaria endemic regions and also an SOM to explain the intensity of malaria
positive cases and Plasmodium falciparum density in different districts of Manipur state. This can help health officials to carry out control operations well in advance in a prioritized locality.
2. Materials and methods
2.1. Study are
Manipur state (Figure 1) is situated at the extreme border of north-eastern India (latitude: 23.800–25.6808N, longitude: 93.30–94.7808E). Its neighbouring state/country is Assam in the west, Nagaland in the north, Mizoram in the south, and Myanmar in the east. It comprises 1820 km 2 of flat plateau of alluvial valley and 20507 km 2 of hill territory. Meteorological data show an average temperature of 218C and rainfall of 1550 mm/year
2.2. Data collection
Epidemiological data were collected from the Directorate of Health, Govt. of Manipur, from 1993 to 2002 from 67 Public Health Centers (PHCs), Imphal (19 PHCs), Thubal (12 PHCs), Bishnupur (3 PHCs), Ukhrul (seven PHCs), Churchandpur (nine PHCs), Chandel (six PHCs), Senapati (three PHCs) and Tamenglong (eight PHCs) used for SOMs.
172 U. S. Murty et al
.JPG)
Figure 1. Map of Manipur state.
2.3. SOMs
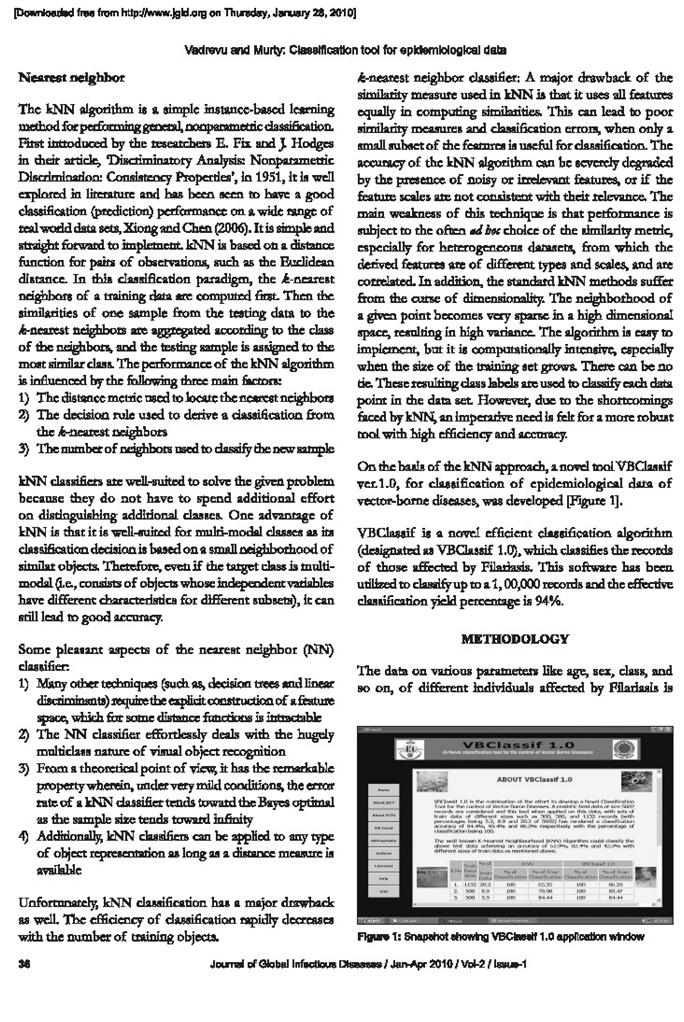
Briefly, SOMs use a data-clustering technique invented by Professor Teuvo Kohonen of Helsinki University of Technology, Finland, in the 1960s which reduce the dimensions of data through the use of self-organizing neural networks [12]. In SOM, the neurons are organized in a lattice, usually a one- or two-dimensional array, which is placed in the input space and is spanned over the input distribution. The processing units in the SOM lattice are associated with weights of the same dimension of the input data. Using the weights of each processing unit as a set of coordinates, the lattice can be positioned in the input space. During the learning stage, the weights of the units change their position and ‘move’ towards the input points. This ‘movement’ becomes slower, and at the end of the learning stage, the network is ‘frozen’ in the input space. After the learning stage, the inputs can be associated with the nearest network unit (Figure 2). When the map is visualized, the inputs can be associated with each cell on the map. One or more cell that clearly contains similar objects can be considered as a cluster on the map. These clusters are generated during the learning phase without any other information. Hence, the main applications of the SOM are to visualize high-dimensional data in a two-dimensional manner, and the creation of abstractions as in many clustering techniques [13].
The characteristic that distinguishes the SOM net from the other cluster algorithms is that not only are similar inputs associated with the same cell but also neighbourhood cells contain similar types of documents. This property together with the easy visualization makes the SOM a useful tool for visualization and clustering of a large amount of data sets [11,24]. Similarly,
the present study is focused on the normalization of data on clusters using SOM for identification of malaria endemic zones in Manipur state.
2.4. Steps involved in the algorithm
1. Initialization: randomly initialize a weight vector (Wi) for each neuron i
Wi ¼ ½wi1;wi2; . . . ;win; n denotes the dimension of input data
2. Sampling: select an input vector X ¼ [x1, x2, . . . , xn]
3. Similarity matching: Find the winning neuron whose weight vector best matches with the
input vector jðtÞ ¼ arg minfjjX Wijjg
4. Updating: update weight vector of winning neuron, such that it becomes still closer to the
input vector. Also, update weight vectors of neighbouring neurons—the further the
neighbour, the lesser the degree of change.
Wiðt þ 1Þ ¼ WiðtÞ þ aðtÞ hijðtÞ ½XðtÞ WiðtÞ
aðtÞ: learning rate that decreases with time t; 0 < aðtÞ 1
hijðtÞ ¼ exp ðjjrj rijj2=2 sðtÞ2Þ
krj rik2 ¼ distance between winning neuron and other neurons
sðtÞ ¼ neighbourhood radius that decreases with time t:
5. Continuation: repeat steps 2–4 until there is no change in weight vectors or up to certain number of iterationFor each input vector, find the best matching weight vector and allot the input vector to the corresponding neuron/cluster.
2.5. Data normalization
Summarized data are normalized linearly in such a way that minimum value in each category is 0, and the maximum is 1. This is done to ensure that all the parameters are given equal importance when clustering is done. The neuron weightage was adjusted by the learning rate. The learning rates and distance threshold values for the SOM are generally default values [15]. Unsupervised learning was done using the data learning constant of 0.01 with 5000
iterations that yielded clusters based on the neighbourhood distance
2.6. Parameters identified for application of SOM
From the collected data, slide positive rate (SPR), slide Falciparum rate (SFR), Plasmodium falciparum rate (PFR), annual parasitic index (API), and annual Falciparum index (AFI) were calculated and used for analysis. All the factors were given equal weight while applying SOM
3. Results and discussion
The average PFR result reveals that there was a constant incidence of PF in many parts of Manipur from 1994 to 2002 which shows improper control measures during those periods. Although there was a substantial reduction in the PFR during 2001 in Imphal, a reappearance has been noticed in 2002, whereas in Churachandrapur there was a constant parasitic load during the 10 years of the survey. Thus, it is assumed that the control measures that might have
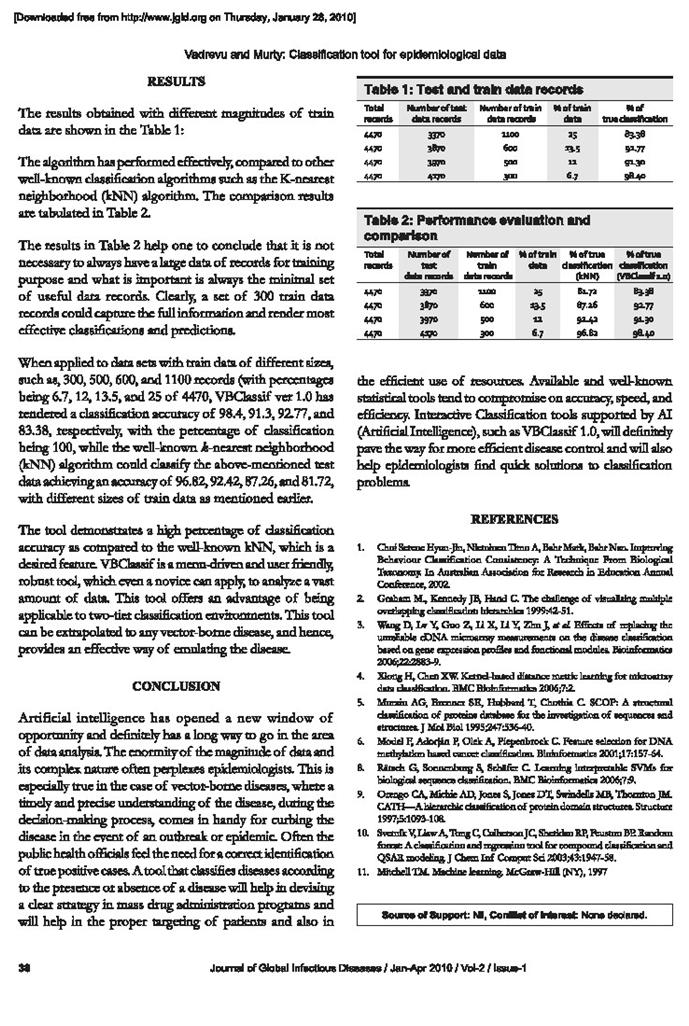
been implemented were not sufficient to suppress the PF load. While analysing the trend in the AFI load in the various regions of Manipur state from 1993 to 2002, PF density was found to be highly correlated with AFI (R 2 ¼ 0.982; p ¼ 0.021). This correlation shows that, out of the four Plasmodium species observed in these regions, the percentage occurrence of falciparum is maintained throughout these periods. However, during 1994, there was sudden increase in the AFI that may be due to the occurrence of a high number of PF cases in Senapati district (reported outbreak of Malaria), whereas in the rest of the years PF and AFI were found to be highly correlated. Similarly, there was a significant correlation between the POS with PF (R2=¼ 0.971; p ¼ 0.018) POS with AFI (R2=¼ 0.920; p ¼ 0.031) were observed during the analysis. When a correlation was done among PF, AFI, and POS, it is observed that all these
factors are interdependent and related to each other (R2=¼ 0.988; p ¼ 0.065) (Figure 3)
3.1. Cluster analysis of malaria data using the SOM
From the above statistical analysis, it is difficult to make conclusions about the suggestion of appropriate control measures for malaria in Manipur. Again, there are several constraints to suppress the occurrence of malaria in a state like Manipur because there are many intrinsic and extrinsic factors (such as hilly areas with acquiescent eco-climatic conditions for breeding of many mosquito species, vast areas to destroy the mosquito breeding habitats or implementation of any effective control measures by the health officials). Thus, it is inevitable that areas need to be prioritized on the basis of the degree of parasitic load or the trend in the presence parasite in the locality. Hence, SOM has been used to prioritize endemic malaria regions of Manipur state, and for these the maximum precautionary measures can be taken to suppress the disease as well as the mosquito population. A classification of data using the SOM is show
Figure 3. Trend of malaria cases in Manipur from 1993 to 2002. POS: positive slide; Pf: Plasmodium falciparum; AFI:
annual falciparum Index.
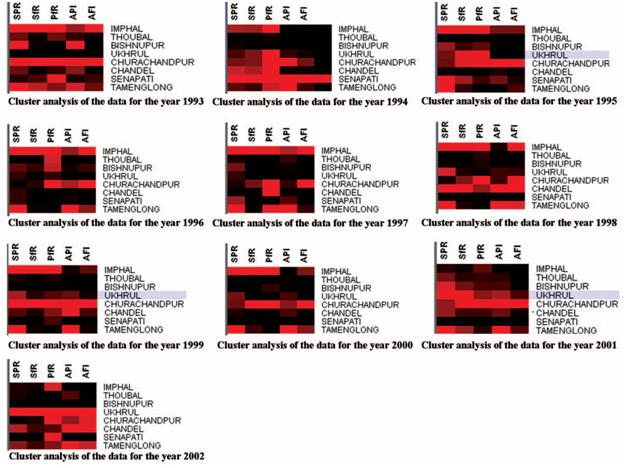
Figure 4. SOM of Kohonen for the malaria data from 1993 to 2002.
in Figure 4. The visualized clusters of the SOM clearly classified it into three groups such as the hyper (red), the hypo (maroon), and the normal (black) for each parameter. By observing the percentage of intensity of the coloration of each cluster, one can take the appropriate decision at a particular locality.
The present investigation shows that among the eight districts, Imphal and Churchandpur districts were found to have the highest parasitic load, whereas in the rest of the districts, there was an increase or decrease in numbers of parasites from 1993 to 2002 (Figure 4). For example, to explain this, the SOM clustered data for 2002 are clustered in 2 6 2 dimensions (Figure 5) into four clusters (1.1, 1.2, 2.1, and 2.2). The specified data have been classified
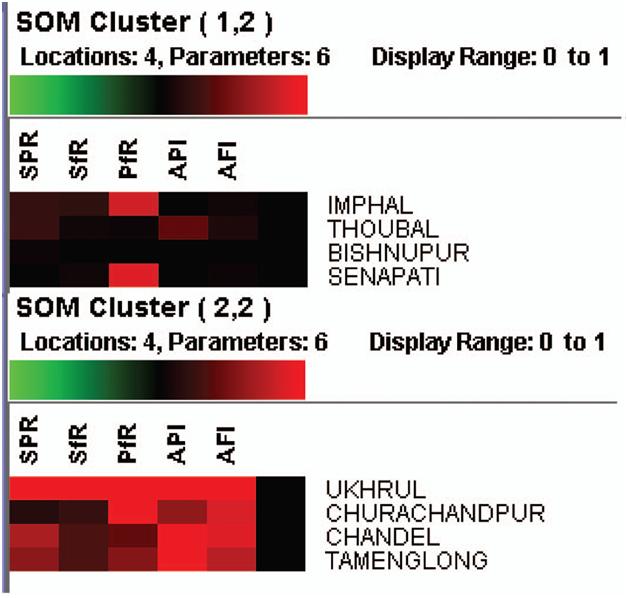
into two clusters as 1.1 and 2.2 by a neighbourhood distance of each value and weights of parameters (Figure 6)
Cluster 1.2 shows that the PF rate is moderately high in Imphal and Senapathi districts with an appreciable decline in malaria indices (SPR/SFR and API) indicative of a sustained decline parasitic load in the community. In cluster 1.2 regions, drug administration should be geared up with special reference to PF susceptible drugs. Cluster 2.2 explains that Ukhrul district is severely affected with malaria cases and reflects the high endemicity, and so the focus should
be on antimalarial operations like drug administration and vector control together. In Churchandpur, the PF rate is high, so vector control is the main strategy for tackling further escalations in PF cases. In Chandel and Tamenglong, the API is very high, and these districts have an opportunity turn to malaria endemic regions. Hence, it counsel to implement drug administration to minimize the parasitic load in these regions to suppress the parasite diffusion
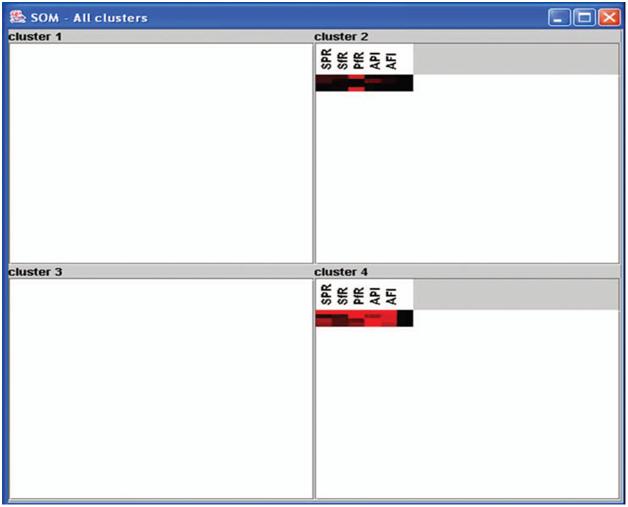
Figure 5. 262 cluster map of 2002 malaria data.
4. Conclusion
Malaria is a major public health concern in the north-eastern states of India. The parasitic load peaks between May and September (wet period) mark the high transmission period. From the longitudinal data for the consecutive years (1993–2002), the transmission of causative parasite species appeared to be persistent, but transmission intensities varied between years and seasons. On the onset of the monsoon period, the malaria (PF) cases gradually increase in April to September and thereafter declines until October/November. In the subsequent months (winter season), there were very few PF cases, and the parasite transmission was found to be very low.
Depending on the previous records, there were many control measures implemented by various public health organizations, but the malaria cases are still rising. The presence of PF cases in these regions may be due to predominance of PF, acquiring chloroquine resistance [16], multiple resistant vectors [20], and congenial eco-climatic conditions [6]. In such situations, if appropriate prioritization is taken in endemic zones, there is every chance of
suppressing the transmission of the disease. Hence, application of SOM in public health areas can support existing control measures effectively. In densely populated countries like India, this kind of application will help the public health officials prioritize endemic villages affected by malaria
Acknowledgements
The authors are grateful to the Director, IICT, Hyderabad for his continuous support and encouragement
- Aron JL. Mathematical modeling of immunity to malaria. Mathematical Biosciences 1988;90:385–396.
- Audibert M, Mathonnat J, Henry MC. Malaria and property accumulation in rice production systems in the savannah zone of Cote d’Ivoire. Tropical Medicine & International Health 2003;8:471–483.
- Booman M, Brian LS, Martin CL, Manjate B. Enhancing malaria control using a computerized managementsystem in Southern Africa. Malaria Journal 2003;13:1–5.
- Breman JG, Egan A, Keusch GT. The intolerable burden of malaria: a new look at the numbers. The American Journal of Tropical Medicine and Hygiene 2001;64:iv–vii.
- Cancre N, Tall A, Rogier C, Faye J, Sarr O. Bayesian analysis of an epidemiologic model of Plasmodiumfalciparum malaria infection in Ndiop, Senegal. American Journal of Epidemiology 2000;152:760–770.
- Dev V, Hira CR, Rajkhowa Mk. Transmission of malaria and its control in the north eastern region of India.Journal of Association of Physicians of India 2003;51:1073–1076.
- Emerenciano VP, Scotti MT, Stefani R, Sandra A. Diterpene skeletal type classification and recognition usingself-organizing maps. Internet Electronic Journal of Molecular Design 2006;5:213–223.
- Fraser LA, Mulholland DA, Fraser DD. Classification of limonoids and protolimonoids using neural networks. Phytochemical Analysis 1997;8:301–311.
- Girardin O, Dao D, Koudou BG, Esse´ C, Cisse´ G, Yao T, N’Gorau EK, Tschannen AB, Bordmann G, Lehmann B, Nsabimana C, Keiser J, Killeen GF, Singer BH, Tanner M, Utzinger J. Opportunities and limitingfactors of intensive vegetable farming in malaria endemic Coˆ te d’Ivoire. Acta Tropica 2004;89:109–123.
- Hoshi K, Junko K, Mitiko K, Sande K, Noriaki N, Hitoshi N, Kenichi S. An analysis of thyroid function diagnosis using Bayesian type and SOM type neural networks. Chemical & Pharmaceutical Bulletin 2005;53:1570–1574.
- Kohonen T. Self-Organized formation of topologically correct feature maps. Biological Cybernetics 1982;43:59– 69.
- Kohonen T. Self-organizing maps. Berlin: Springer;1995.
- Kohonen T. Self-organizing maps. Berlin: Springer;2000.
- Kohonen T. Self-organizing maps. Berlin: Springer;2001.
- Markey MK, Lo JY, Tourassi GD, Floyd CE Jr. Self-organizing map for cluster analysis of a breast cancer database. Artificial Intelligence in Medicine 2003;27:113–127.
- Mohapatra PK, Namchoon NS, Prakash A, Bhattaoharya DR, Goswami BK, Mahanta J. Herapeutic efficacy of anti-malarials in Plasmodium falciparum malaria in an Indo-Myanmar border area of Arunachal Pradesh. Indian Journal of Medical Research 2003;118:71–76.
- Mariane BF, Scotti MT, Ferreira MJ, Emerenciano VP. Use of self-organizing maps and molecular descriptors to predict the cytotoxic activity of sesquiterpene lactones. European Journal of Medicinal Chemistry 2008 (in press).
- World Health Organization. Making a difference. The World Health Report. Geneva: World Health Organization, 1999.
- Noden BH, Kent MD, Beier JC. The impact of variations in temperature on early Plasmodium falciparum development in Anopheles stephensi. Parasitology 1995;111:539–545.
- Sharma VP. Re-emergence of malaria in India. Indian Journal of Medical Research 1996;103:26–45.
- Snow RW, Rogers DJ. From predicting mosquito habitat to malaria seasons using remotely sensed data: practice, problems and perspectives. Parasitology Today 1998;14:306–313.
- Sachs J, Malaney P. The economic and social burden of malaria. Nature 2002;415:680–685.
- Shiv Lal, Sonal GS, Phukan PK. Status of Malaria in India. Journal of Indian Academy of Clinical Medicine 2000;5:19–23.
- Vargas CE, Romero RAF. A SAM–SOM family: incorporating spatial access methods into constructive selforganizing maps. In: Proceedings of the International Joint Conference on Neural Networks—IEEE, Honolulu, HI, 2002
2. Prioritization of Malaria endemic zones in Arunachal Pradesh: A novel application of self organizing maps (SOM).
3 Management of Filariasis using predection rules derived from data mining.
Bioniformation by Biomedical Informatics Publishing Group
Disease Management Model
Management of filariasis using prediction rules derived from data mining
Duvvuri Venkata Rama Satya Kumar, Kumarawsamy Sriram, Kadiri Madhusudhan Rao and Upadhyayula
Suryanarayana Murty
Bioinformatics Group, Biology Division, Indian Institute of Chemical Technology,
Uppal Road, Hyderabad - 500 007, Andhra Pradesh, India
received March 21, 2005, revised March 29, 2005, accepted April 04, 2005, published online April 06, 2005
Abstract:
The present paper demonstrates the application of CART (classification and regression trees) to control a mosquito vector (Culex quinquefasciatus) for bancroftian filariasis in India. The database on filariasis and a commercially available software CART (Salford systems Inc. USA) were used in this study. Baseline entomological data related to bancroftian filariasis was utilized for deriving prediction rules. The data was categorized into three different aspects, namely (1) mosquito abundance, (2) meteorological and (3) socio-economic details. This data was taken from a database developed for a project entitled “Database management system for the control of bancroftian filariasis” sponsored by Ministry of Communication and Information Technology (MC&IT), Government of India, New Delhi. Predictor variables (maximum temperature, minimum temperature, rain fall, relative humidity, wind speed, house type) were ranked by CART according to their influence on the target variable (month). The approach is useful for forecasting vector (mosquito) densities in forthcoming seasons.
Key words: Disease management, vector-borne disease, bancroftian filariasis, data mining, classification and regression trees.
Background:
Public health management requires an understanding of disease transmission, vector control and disease morbidity.
Bancroftian filariasis is a mosquito borne disease, infecting nearly 60 million people in South East Asian countries. The annual economic loss due to filariasis in India alone is U.S$1.5 billion.[1-3] The tropical and sub-tropical climate
facilitates the proliferation of the mosquito vector (Culex quinquefasciatus) for filariasis. [4-5] The mosquito borne
disease is a threat to human population despite the practice of several control strategies. [6] Proper planning and
implementation of control measures require adequate exploitation of the available data for disease management.
Therefore, it is of interest to develop prediction methods to augment existing mosquito control strategies. Murty et al.
used rule-based systems for rapid and accurate identification of malaria causing 54 Indian Anopheline mosquito species. [7] Thus, the use of prediction models in disease management has been realized. [8-10] These tools
help epidemiologists to predict the future courses of vector borne diseases. Here, we derive decision rules for vector
surveillance using CART (classification and regression tree).
meteorological and socio-economic conditions influencing mosquito survival was used. The mosquito density was
expressed in PMHD (per man hour density), which is the total catch of female Culex quinquefasciatus, per hour
spent for mosquito collection. [4]
Dataset Processing:
The raw data was stored in Excel 2000 (Microsoft Corporation). The data consists of several fields describing each attribute. The attributes include (1) collection date, (2) door number, (3) village name, (4) taluk name (5) district name, (6) unit name, (7) family background, (8) number of children, (9) knowledge of filariasis, (10) house type (11) maximum temperature, (12) minimum temperature, (13) total rainfall, (14) relative humidity, (15) wind speed and (16) mosquito density (PMHD). Seven of the sixteen attributes were further used for developing association rules. These include (1) maximum temperature, (2) minimum temperature, (3) total rainfall, (4) relative humidity, (5) wind speed, (6) house type, and (7) mosquito density. These attributes form the independent (predictor) variables. The dependent (predictive) variable is month describing different seasons and climatic conditions of the region. All variables except house type and month are continuous. The four house types include, (1) hut, (2) RCC (reinforced concrete cemented), (3) thatched, and (4) tiled.
Methodology:
Dataset:
A mosquito abundance dataset consisting of 5790 subjects or records with 15 attributes each reflecting the
ISSN 0973-2063
Bioinformation 1(1): 8-11 (2005)
Bioinformation, an open access forum
D.V.R.S.Kumar, K. Sriram, K.M. Rao and U.S.N Murty under the open access policy
The author(s) are responsible for the information published in this forum
Bioinformation by Biomedical Informatics Publishing Group
Disease Management Model
Table 1: Classification of predictive variable based on predictor variables
| Predictor (independent variables) |
Predictive (dependent variable) |
S.
No |
WS (Km/hr) |
Max. Temp (x) (0C) |
Min.
Temp |
RH(%) |
TRF(MM) |
HT |
P.M.H.D |
M |
| 1 |
1.5< to <=6.5 |
32.4< to <40.15 |
<=21.85 |
>54 |
<=261 |
Any |
>17.75 to 18.03 |
February |
| 2 |
NC |
NC |
>21.85 |
NC |
<=9.45 |
Any |
>20.75 |
March |
| 3 |
<= 8.5 |
36.95 < to
<=40.15 |
>21.8 |
NC |
<=54 |
Any |
<= 2.4295 |
April |
| 4 |
<=4.5 |
<=34.9 |
>21.85 |
<54 |
>19.7 to
<=142 |
Any |
>20.75 |
April |
| 5 |
<=8.5 |
<=40.15 |
NC |
NC |
NC |
Any |
<=2.42 |
May |
| 6 |
NC |
35.6< to <=38.8 |
<=25.1 |
NC |
NC |
Any |
>11.7 to <=13.7 |
June |
| 7 |
<=6.5 |
<=34.9 |
NC |
NC |
NC>26.6 to <=261 |
Any |
>17.7 to <=18.03 |
August |
| 8 |
<=8.5 |
33.4< to <=34.2 |
>21.85 |
NC |
NC |
Thatched,
Tiled,
RCC |
>11.7 to <=13.75 |
September |
| 9 |
<=8.5 |
33.4< to <=34.2 |
>21.85 |
>142.4 |
NC |
Hut |
>13.75 |
September |
| 10 |
NC |
33.4< to <=35.1 |
<=25.1 |
NC |
NC |
Hut |
>11.7 to <=13.75 |
October |
| 11 |
NC |
NC |
>21.85 |
>142.2 |
NC |
RCC |
>29.2 to <=51 |
October |
| 12 |
NC |
33.4< to <=35.1 |
<=25.1 |
NC |
NC |
Thatched,
Tiled |
>39 to <=44.9 |
October |
| 13 |
NC |
NC |
>21.85 |
>142.2 |
NC |
Hut |
>63 to <=84 |
November |
| 14 |
NC |
NC |
>21.85 |
>142.2 |
NC |
Thatched,
Tiled, RCC |
>51 to <=64 |
November |
| 15 |
NC |
NC |
>21.85 |
>142.2 |
NC |
Hut |
>64 to <=84 |
December |
| 16 |
NC |
NC |
>21.85 |
>142.2 |
NC |
Thatched,
Tiled, RCC |
<=64 |
December |
| 17 |
1.5< to <=6.5 |
32.4< to <=36.05 |
>21.85 |
NC |
<=261 |
Any |
>17.75 to <=18.03 |
January |
WS = wind speed; Max. Temp = maximum temperature; Min. Temp = minimum temperature; TRF = total rainfall; HT = house type; M = month; NC = not considered for classification by CART and P.M.H.D = per man hour density
ISSN 0973-2063
Bioinformation 1(1): 8-11 (2005)
Bioinformation, an open access forum
D.V.R.S.Kumar, K. Sriram, K.M. Rao and U.S.N Murty under the open access policy
The author(s) are responsible for the information published in this forum
Discussion:Data formats:
The disease transmission dynamics is modeled using theThe raw data was stored in EXCEL and the analysis was
parameters such as vector (pathogen transmitting agent)performed using a commercial software CART (Salford
surveillance, parasitic load in the human community andsystems Inc. USA). Hence, the raw data was converted to a
sudden environmental changes [6]. We used data miningCART compatible CSV (comma delimited) format.
tools in CART to find relationships between vector data and the predictive variable. These relations are generallyData mining tool hidden in a large dataset. The <IF-THEN> rules in theCART version 5.0 from Salford Systems, California, USA, CART system is used for the prediction of filarialwas used for the current analysis [11]. CART is a robust transmission vectors in an effective way.and powerful tree based tool for data classification [12]. The tool is suited for the analysis of categorical The PMHD recorded during the summer months for rules(classification) and continuous (regression) datasets. The #3 and #5 show that there is no risk of filariasis when thetool uses binary recursive partitioning, in which the parent role of other influencing parameters is negligible. In Tablenodes are exactly split into two child nodes in a recursive 1, for rule #4, the PMHD is high due to high relativemanner until the tree is terminated. This depends on the humidity and total rainfall. This results in an increased riskrules used for splitting each node in a tree until the tree is of disease transmission under these conditions in April.complete. In this process, each terminal node is assigned to During the months of October, November and December, aa class outcome. CART contains sound statistical tool that high PMHD (>29.2 to <=84) is recorded for different houseenables the development of fast and accurate models. The types (rules #11, #13, #14, #15 and #16). These rulessteps used in the analyses are summarized as follow. The suggest that the relative humidity is a critical variable onCSV formatted data is loaded to CART using the user vector density. For rules #1, #2, #7 and #17, the PMHD isinterface. The loaded data is used to select and define elevated due to high total rainfall. Table 1 shows that theindependent variables (predictor) and predictive four predictors, namely, (1) total rainfall, (2) maximum(dependent) variables. In this analysis, we defined month as temperature, (3) minimum temperature, (4) relativepredictive and the other seven variables as predictors. The humidity and (5) wind speed influenced the target variableGINI splitting function is used to maximize the average
in descending order. This is helpful in ranking thepurity of two child nodes. [12] CART contains two tree predictive variables. Thus, decision trees play an importanttypes, namely (1) classification and (2) regression. The role in the management of vector borne diseases.predictive variable (month) is categorical in this analysis. Hence, we used classification type tree model for this analysis.Conclusions: The principal vector for bancroftian filariasis is the
mosquito Culex quinquefasciatus. Surveillance of theResults: filariasis vector is an important issue in diseaseThe CART analysis generated a decision tree with 133 management. Here, we show that decision rules help toterminal nodes based on the selection criteria. Every predict and forecast mosquito density during differentterminal node represents a decision rule. Out of the 133 months of a year in the region. Thus, prediction of vectorterminal nodes, 17 decision rules were in agreement with density is important towards the effective control of vectormeteorological and socio-economic parameters. The borne diseases.decision rules (IF – THEN) used in this analysis are given
in Table 1. Data in Table 1 shows the distribution of Culex Acknowledgements:quinquefasciatus density (≤ 2.42 to 84) in PMHD unit over Authors are grateful to the Director, IICT, Hyderabad fordifferent months of a year. A very low PMHD of ≤ 2.42 is his continuous support and help. Thanks are due toreported for rules #3 and #5 in Table 1. These values
Ministry of Communication and Information Technology,correspond to the summer months April and May. This
Government of India, New Delhi for their financial support. observation corresponds to high maximum temperature (≤
oo40.15 C in April and >40.15 C in May) during these References:months. Thus, high temperature is an influencing parameter1E.A.Ottesen et al, Bull.Wld.Hlth.Org, 75: (6): 491-503 for low PMHD in April and May. However, it is also found
4. Prediction of japanese encephalitis vectors in kurnool District of andhra pradesh, india by using bayesian network
This article was downloaded by: [CSIR eJournals Consortium]
On: 28 October 2009
Access details: Access Details: [subscription number 909878534]
Publisher Taylor & Francis
Informa Ltd Registered in England and Wales Registered Number: 1072954 Registered office: Mortimer House,
37-41 Mortimer Street, London W1T 3JH, U |

Applied Artificial Intelligence
Publication details, including instructions for authors and subscription information:
http://www.informaworld.com/smpp/title~content=t713191765
PREDICTION OF JAPANESE ENCEPHALITIS VECTORS IN KURNOOL
DISTRICT OF ANDHRA PRADESH, INDIA BY USING BAYESIAN NETWORK
Upadhyayula Suryanarayana Murty a; Mutheneni Srinivasa Rao a; Natarajan runachalam b a
Bioinformatics Group, Biology Division, Indian Institute of Chemical Technology (CSIR), Andhra Pradesh,
India b Centre for Research in Medical Entomology (ICMR), Madurai, India
Online Publication Date: 01 October 200
To cite this Article Murty, Upadhyayula Suryanarayana, Rao, Mutheneni Srinivasa and Arunachalam, Natarajan(2009)'PREDICTION
OF JAPANESE ENCEPHALITIS VECTORS IN KURNOOL DISTRICT OF ANDHRA PRADESH, INDIA BY USING BAYESIAN
NETWORK',Applied Artificial Intelligence,23:9,828 — 834
To link to this Article: DOI: 10.1080/08839510903235362
URL: http://dx.doi.org/10.1080/08839510903235362 |
PLEASE SCROLL DOWN FOR ARTICLE
|
Full terms and conditions of use: http://www.informaworld.com/terms-and-conditions-of-access.pdf
This article may be used for research, teaching and private study purposes. Any substantial or systematic reproduction, re-distribution, re-selling, loan or sub-licensing, systematic supply or distribution in any form to anyone is expressly forbidden.
The publisher does not give any warranty express or implied or make any representation that the contents
will be complete or accurate or up to date. The accuracy of any instructions, formulae and drug doses
should be independently verified with primary sources. The publisher shall not be liable for any loss,
actions, claims, proceedings, demand or costs or damages whatsoever or howsoever caused arising directly
or indirectly in connection with or arising out of the use of this material
|
Applied Artificial Intelligence, 23:828–834
Copyright © 2009 Taylor & Francis Group, LLC
ISSN: 0883-9514 print/1087-6545 online
DOI: 10.1080/08839510903235362
PREDICTION OF JAPANESE ENCEPHALITIS VECTORS IN KURNOOL DISTRICT OF ANDHRA PRADESH, INDIA
BY USING BAYESIAN NETWORK
Upadhyayula Suryanarayana Murty 1, Mutheneni Srinivasa Rao 1,and Natarajan Arunachalam2
1Bioinformatics Group, Biology Division, Indian Instituteof Chemical Technology (CSIR), Andhra Pradesh, India
2Centre for Research in Medical Entomology (ICMR), Madurai, India
Japanese encephalitis (JE), a complex viral disease transmitted by mosquitoes. Determination of vector (mosquito) density is a prerequisite for devising effective control measures against this disease. Bayesian network is a widely used tool that has recently found application in the epidemiological surveillance studies. This article describes the application of Bayesian network tool to predict the Japanese encephalitis vector density using the longitudinal data collected from the Kurnool district of Andhra Pradesh, India, from 2001 to 2006. The entomological parameter from the study area indicates that various contributing factors are responsible for the prevalence of these vectors, making it difficult to estimate the importance of any particular parameter contributing to the increase of vector density. The application of this approach resulted in 73.12% to 95.12% accuracy compared to the test data with the corrected data
The Bayesian network has gained popularity in clinical epidemiology for the construction of appropriate disease models and diagnosis (Dunson and Baird 2001; Heckerman 1991), interpretation of microarray gene
expression and prediction operons (Bockhorst et al. 2003), weather forecasting (Abramson et al. 1996), and disease outbreaks (Tsui et al. 2003). This technique offers the possibility of an extensive statistical treatment of complex epidemiological models including inference about model parameter values, calculations of confidence intervals for model predictions, model checking, and hypothesis testing (Cancre et al. 2000)
The authors are grateful to Director, IICT for his encouragement and support. The authors are thankful to the Indian Council of Medical Research (ICMR), New Delhi, for sponsoring and supporting the project.
JEBNET: Prediction of JE Vector Density
A Bayesian model has been used for prioritization and identification of communities requiring ivermectin treatment in Amazonian (Carabin et al. 2003). Along similar lines, the present study describes development of a Bayesian model that has been developed for predicting vector density (per man hour density (PMHD)) of Japanese encephalitis (JE) mosquitoes in the Kurnool district of Andhra Pradesh, India.Address correspondence to Dr. Upadhyayula Suryanarayana Murty, Indian Institute of Chemical Technology (CSIR), Tarnaka, Hyderabad 500 007, Andhra Pradesh, India. E-mail: murty_usn@ yahoo.co
MATERIALS AND METHODS
Study Area and Eco-Climatic Condition
The Kurnool district of Andhra Pradesh, India was selected for the present study because the highest number of JE cases were reported from this region since 1996 (Figure 1). The area is located between 15.83 ◦N,78.05◦E. Most of the population is affianced in agricultural practices. Patchy paddy fields and water loggings are commonly seen in and around Kurnool district. Domestic animals commonly share the habitat with the human population. This district is generally warm and humid during most parts of the year. These factors were considered for this study because of their direct or indirect contribution towards the development of the prediction model of Japanese encephalitis vector density.
Data Collection
Data was collected from six regions (5 rural and 1 urban) reporting incidence of JE comprising of Peddathumbalam, Nandanapalli, Nandikotkur, Gudur, Cherukulapadu, and Kurnool urban areas from 2001 to 2006. The collected data consists of entomological, agricultural, and
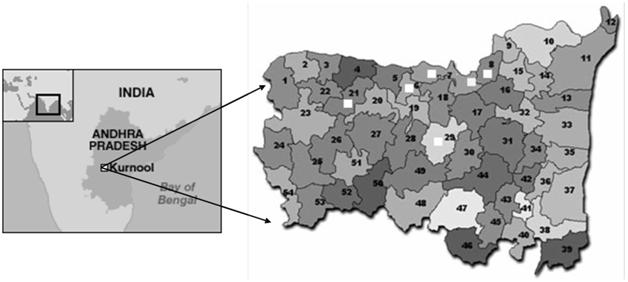
FIGURE 1 Map showing the location of Kurnool district of Andhra Pradesh, India.
U. Suryanarayana Murty et al.
meteorological data and was used for the construction of the Bayesian network.
Vector Surveillance
Vector surveillance was initiated in all six index areas to know the seasonal prevalence of JE vectors. The mosquito population was sampled during dusk hours (6:30PM to 7:30 PM). Indoor and outdoor resting mosquitoes were collected from the fixed cattle sheds every month with the help of mechanical aspirators (Hausherr’s Machine Works, NJ, USA). Light traps were also used for sampling the vector population. The collected mosquitoes were separated species-wise and the relative density of female mosquitoes was recorded as the number of females collected per man hour (PMH). The captured mosquitoes were segregated into different pools (50 mosquitoes per pool) and were screened for infectivity towards Japanese encephalitis virus by the enzyme linked immunosorbent assays (ELISA) method (Gajanana, Rajendran, and Thenmozhi 1995).
Collection of Agricultural and Meterological Details
In the study area, the entomological and epidemiological details were collected in addition to other details like agriculture in hectares, paddy cultivation in hectares, crops per year, crop seasons, irrigation sources, water stagnation period in paddy, types of fertilizers, summer crops, piggeries, cattle sheds, positive JE cases/deaths and
vaccination details have been collected from the selected study areas. Meteorological conditions of the study areas were collected from the Indian Meteorological department, Hyderabad.
Japanese Encephalitis-Bayesian Network (JEBNET)
JEBNET carries out the prediction of the JE mosquito population in three phases.
Phase-1
This is the classical Bayesian network phase. To predict a child node in the Bayesian network, the program checks the values of the parent nodes provided and examines the database looking for all instances where the pattern of the values taken by the parent nodes matches the given set.
Phase-2
This is an extension phase and is used because the limited size of the database makes it highly probable that a given assignment tuple of Downloaded By: [CSIR eJournals Consortium] At: 04:19 28 October 2009 JEBNET: Prediction of JE Vector Density 831 values of the parent nodes has not been perceived before. In such a case, compute the value of the child and measure how much is necessary to disturb a state for which we know the exact solution. Next, how much this perturbation of the values of the parents affects the child node in general over the entire database was taken into account. Suppose the value of the child changes by the tuple A, and with the known pattern the value of the child is represented by the tuple B. Then the projected value of the child is given by the tuple A + B.
Phase-3
This final phase begins when the database contains neither a single record with the required assignment tuple for the parent nodes nor a single pair of records whose assignment tuples for the parent nodes vary by the required difference tuple. In this case, the difference tuple is split up into its components in the various coordinates and each difference is treated as a separate difference tuple. The shifts computed for the separate difference tuples are all added up to obtain the resultant shift, which is then added to the base value to obtain the predicted value.
JEBNET APPLICATION RESULTS
For a given set of parameters influencing a certain event, it sometimes happens that not all the parameters influence the occurrence of the event in a similar fashion. Some parameters might influence the occurrence of the event in a more direct way and some in an indirect way. For example, temperature, rainfall, and paddy cultivation are the important factors that directly influence the JE mosquito population, whereas other climatic factors such as relative humidity and wind speed indirectly affect their population. For the analysis using a Bayesian network, month, wind speed, rainfall, relative humidity, maximum temperature, minimum temperature, irrigation, agricultural area, area for paddy cultivation, water depth in paddy fields, piggeries, cattle sheds records were considered in predicting the density of mosquito population. The network primarily contains the information about relationship and interdependence variables. The Bayesian network designed for the above-collected parameters is shown in Figure 2.
The algorithm used in this model to predict the PMHD of JE mosquitoes is a slight modification of the Bayesian network algorithm and the preprocessing system is implemented on a PC platform using JAVA programming language. Figure 3 shows the main window where the user may select the Bayesian belief network file, data files, selection of agriculture, meteorological parameters, and test data files.
U. Suryanarayana Murty et al.
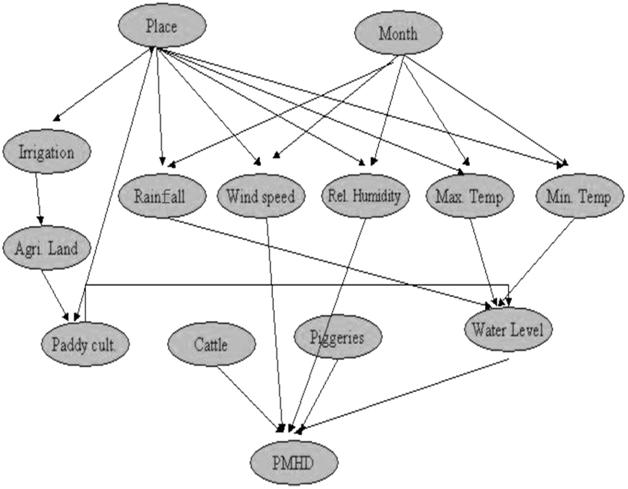
FIGURE 2 The structure of the Bayesian network – JEBNET model.
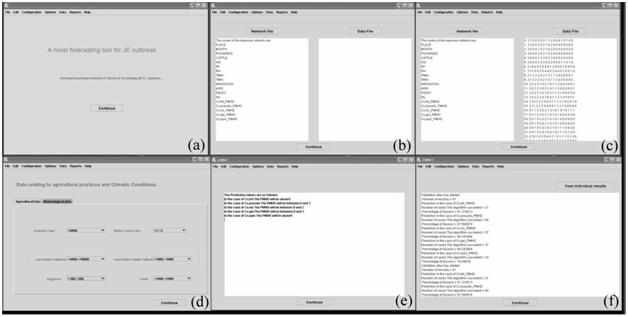
FIGURE 3 The main windows of JEBNET. (a) JEBNET home page; (b) Selection of Bayesian belief network file; (c) Selection of data file; (d) Agricultural and meteorological details selection; (e) Prediction results of JEBNET; and (f) Comparison of results with test data.
JEBNET: Prediction of JE Vector Density
TABLE 1 Percentage of Accuracy by Species Wise of Prediction Results
| Mosquito type |
Test cases |
Correct cases |
Percentage of accuracy |
| Culex tritaniorhynchus |
41 |
30 |
73.17 |
| Culex psuedovishnui |
41 |
39 |
95.12 |
| Culex vishnui |
41 |
37 |
90.24 |
| Culex gelidus |
41 |
36 |
87.80 |
| Culex quinquefasciatus |
41 |
30 |
73.17 |
This algorithm attempts to calculate the mosquito population that can occur with maximum likelihood.
This likelihood of an event is calculated as follows:
Likelihood of an event A = Number of cases in which the event A occurs
---------------------------------------------------------------
Total number of cases in the database
The JEBNET model uses a data file that contains the different parameters specified in the belief network file. The network file contains meteorological, agricultural, and animal parameters. The model was tested in a variety of ways to verify its value in all conditions. The test involved testing the overall performance of the model in terms of prediction of
PMHD and its accuracy.
Information intercorrelating values of these parameters and giving the PMHD for the known and suspected mosquito vectors under the given conditions was provided. Data collected from Cherukulapadu, Gudur, Nandanapalli, Nandikotkuru, and Peddatumbalam of the Kurnool district of Andhra Pradesh from June 2002 to July 2004, giving a total of 69 known patterns, was applied for JEBNET.
The data was partitioned in such a way that data collected over a year was used as training data and the remaining data was used for testing the accuracy of the Bayesian network. The reason for using the data collected over a year for training the system was to make sure that the system was trained for all possible cases during the training data collected over the year 2002 and test data collected over the year 2003.
JEBNET also provided the percentage of accuracy of the prediction by species-wise and the results are shown in Table 1.
CONCLUSIONS
This study presents a computational method, based on a Bayesian network, for predicting the PMHD of JE transmitting vectors. This method takes advantage of a variety of data sources including agricultural, meteorological, and animal data that were used to provide the density Downloaded By: [CSIR eJournals Consortium] At: 04:19 28 October 2009 834 U. Suryanarayana Murty et al. of vectors well in advance, which help in effective control of disease
outbreaks. This method may assist the public health decision-makers to plan and implement disease and vector control interventions and to allocate public health resources more effectively and efficiently. Results of studies such as this may facilitate the development of a prediction model through a Bayesian network for reducing the incidence of this widespread Japanese encephalitis disease.
REFERENCES
- Abramson, B., J. Brown, W. Edwards, A. Murphy, and R. Winkler. 1996. Hailfinder: A Bayesian system for forecasting severe weather. International Journal of Forecasting 12:57–72.
- Bockhorst, J., M. Craven, D. Page, J. Shavlik, and J. Glasner. 2003. Bayesian network approach to operon prediction. Bioinformatics 19:1227–1235.
- Cancre, N., A. Tall, C. Rogier, J. Faye, O. Sarr, J. Trape, A. Spiegel, and A. Bois. 2000. Bayesian analysis of an epidemiologic model of plasmodium falciparum malaria infection in Ndiop,
- Senegal. American Journal of Epidemiology 152:760–770. Carabin, H., M. Escalona, C. Marshall, S. Vivas-Martínez, C. Botto, L. Joseph, and M. G. Basáñez.
- 2003. Prediction of community prevalence of human onchocerciasis in the Amazonian onchocerciasis focus: Bayesian approach. Bulletin of the World Health Organization 81:482–490.
- Dunson, D. B. and D. D. Baird. 2001. A flexible parametric model for combining current status and age at first diagnosis data. Biometrics 57:396–403.
- Gajanana, A., R. Rajendran, and V. Thenmozhi. 1995. Comparative evaluation of bioassay and ELISA for detection of Japanese encephalitis virus in field collected mosquitoes. Southeast Asian Journal
- of Tropical Medicine and Public Health 26:91–97. Heckerman, D. 1991. Probabilistic Similarity Networks. Cambridge: MIT Press.
- Tsui, F., J. Espino, V. Dato, P. Gesteland, J. Hutman, and M. Wagner. 2003. A real time public health surveillance system. Journal of American Medical Informatics Association 10:399–408.
5. A novel tool for classification of epidemiological data of vector borne diseases
.JPG)